F-SAE Electric Vehicle

F-SAE (Formula Society of Automotive Engineers) is a student design competition where all participating teams produce formula-style vehicles. There are a handful of these competitions annually, the most significant one occurring in June at Michigan International Speedway. These vehicles must complete a series of tests that verify mechanical, electrical, and environmental inspections. Once the tests are passed, the vehicle competes in events testing the vehicle's acceleration, cornering, autocross, and endurance capabilities. All vehicles receive a panel of judges, regardless of whether or not they are allowed to drive. These judges score vehicles according to aerodynamics, vehicle dynamics, chassis, powertrain, driver interface, and electrical properties. This score is ultimately the most significant for the team as the event is a design competition, not solely a racing competition.
On June 15, 2025, two teammates and I towed UC Santa Barbara's electric vehicle (GR 25) from southern California to Jackson, Michigan (and back). Our team of thirty students from UCSB spent six days at this year's design competition assembling our vehicle, putting it through several mechanical inspections, interacting with schools with neighboring trailers, receiving feedback from judges, and making connections with scouting companies. This was our schools third year competing in this competition. We were pushed to our mental and physical limits, building resilience and stronger camaraderie along the way. This experience was incredibly valuable to me, as it was my first experience with formula vehicle competitions. I learned what it was like to work quickly under pressure and improvise as our plans had to adjust to the depleting time. In this section, I hope to get you invested in the work I completed for the car throughout the year, what the experience at the design competition entailed, and how I intend to step up this year so my university may have its first vehicle that races in Michigan.
Before the Competition
Gaucho Racing is UC Santa Barbara's formula design team. I was aware of the program when I entered college, but I had not worked with them leading into Fall 2024. However, UCSB's mechanical engineering department permitted two aspects of the next year's car to operate as senior projects: the accumulator box (battery pack storage box) and the cooling system. I applied and was ultimately accepted into the cooling system project. Our team had a meeting shortly after team selection to define the main objectives.
The most important components that require cooling are the motors, inverters, and batteries. The motors and inverters didn't have any defined temperature limits by the design competition, but our team decided motors should remain under 100 ºC and the inverters remain under 120 ºC for efficiency purposes. These values were chosen based on manufacturer recommendation. In contrast, the Michigan design competition clearly defined all points on the battery pack must remain under 60 ºC. These temperatures would not be significant for the shorter racing events, but would be critical for the endurance event (the event teams often struggle the most with).

Our team realized cooling the batteries would be more challenging than the motors and inverters. The temperature constraints were tighter, and the nature of the battery segments made their thermal resistance far greater than any motor or inverter. This vehicle's battery pack consisted of five boxes, each containing 84 Li-ion batteries. The battery packs were 120 V each (maximum permitted voltage by the competition is 600 V), with electrically insulating walls. Heat exchangers could only interact with the battery packs from below or above (the sides must be walled off according to the competition and the plastic is not very thermally conductive). We decided to cool them from below, as the solder contacts for the batteries are on the top and in the off-chance our cooling loop leaked, we did not want water to drip onto the batteries. Cooling from underneath the packs would mean that the hottest points of the battery packs would be on the top surface, so our team decided we would monitor the tops with numerous thermocouples.
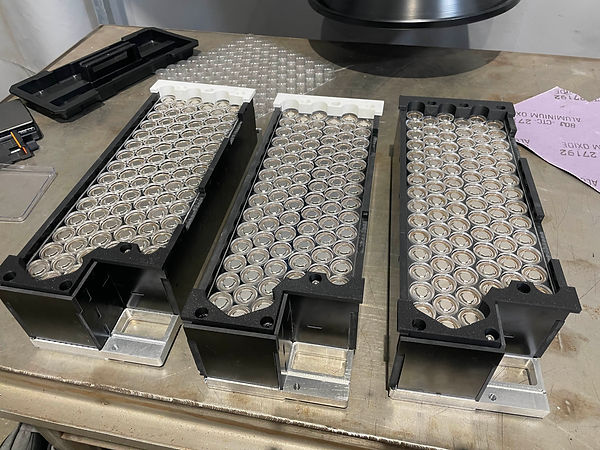

Visual of completed battery packs with heat exchangers underneath (right picture showing battery insertion)
Diagram of battery packs in accumulator box (isometric and perpendicular view)


The nature of the more challenging battery packs encouraged our team to develop two separate cooling loops. One would be dedicated to the battery packs and one for the motors/inverters. Convective heat exchangers are a popular way to cool these kinds of components, as their potential for higher heat transfer coefficients (HTC) result in more effective cooling. Forced air is generally how most teams approach this problem due to:
-
material abundance
-
lightweight properties
-
does not require a complicated loop
-
relative speed between car and atmosphere
The option our team pursued was implementing two water cooling loops. Our reasoning includes the following:
-
higher thermal conductivity than air
-
more controllable coolant speed
-
battery pack walls make it more difficult to push air in between battery cells
While air would introduce less mass than liquid coolant, the potential for a higher heat transfer coefficient was more valuable to us. The competition restricted coolant to either oil or water with no additives. The thermal conductivity of water is usually much higher than oil, so that was the chosen additive. Each loop's components were connected with plastic tygon tubing. The cooling loops are drawn below.


Diagrams of cooling loops (left for battery loop, right for motor/inverter loop) with color indicating coolant temperature (red is hot, blue is cold)
Battery Cooling Loop
As previously mentioned, the battery packs were the most critical components to keep within temperature restrictions. Not only would this impact battery efficiency; this could compromise safety. This loop dedicated a single pump and reservoir towards all five battery packs arranged in two parallel paths. Our team weighed other options such as all modules in series, all in parallel, or three pathways. Putting all the modules in series would results in the highest flow rate through each battery pack, but would also mean that the module at the end of the path would be interacting with the hottest coolant. The design competition outlined that the car must not operate if the battery packs exceed 60 ºC, which applies to any of them. Even if four battery packs were below critical temperature, the car must shut down if one of them was above. Parallel was the optimum choice for uniformity, but our chosen pump did not produce the flow rate we originally expected (pump chosen due to restricted budget). The battery cooling pump could barely push 1.6 gallons per minute of water when only interacting with one cold plate. Splitting into five pathways would cut the flow rate through all cold plates down to 0.32 gpm, heavily compromising the heat transfer coefficient of heat exchangers. We chose two pathways instead of three because it would yield a higher flow rate through each heat exchanger, and the orientation of the accumulator box had two floors (one with two battery packs and one with three). Using two pathways made it simpler to set up and troubleshoot the cooling loop.
The electric pump in the battery cooling loop (EBP40 12V) was largely chosen due to budget and head loss simulations from our heat exchanger. Our team simulated, given a flow rate that would produce turbulent flow, what the expected head loss from a single heat exchanger would be. This pump features a pressure head of roughly 8.5 m, according to the manufacturer website. It was originally confirmed with simulations that this pump would achieve turbulent flow with five battery heat exchangers in series.
The water reservoir was to be cooled to ice water temperature (0 ºC) when installed on the car. This was inspired by San Jose State University's formula design team, who "pre-chilled" their cooling loop before the endurance event at a design competition in November 2024 (So-Cal Shootout). This fundamentally makes sense, as the length of time before the cooling loop increases if the difference between initial and final temperatures increases. Our team decided that we would try to improve this tactic by almost freezing the water in the cooling loop before competing. We would do this by continuously adding ice to our reservoir and emptying out warmer water until our temperature sensors indicated steady-state temperature close to 0 ºC. We would also make sure to leave spare ice in the reservoir in order to extend the cooling system's time of effectiveness. Not only would this add mass that would take more energy to heat up, but the energy required for melting ice into water would add time. Our team purchased an insulating Igloo container so that the surrounding air could not prematurely heat up the water. Once the container was received, we turned it into a functional reservoir by milling an inlet and outlet.


EBP 40 pump and Igloo ice water reservoir
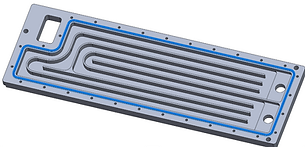
The heat exchangers in the battery cooling loop consist of the majority of our team's work in the 2024-2025 school year (October through June). We manufactured five custom "battery cold plates", with dimensions defined by the assigned battery pack size, accumulator box size, and simulations optimizing thermal and fluid dynamic properties.


CAD model and manufactured battery cold plates (right picture with battery pack walls)
Each heat exchanger featured four pathways for water to travel through. The inlet and outlet were on the same side of the exchanger. This specific design minimized the maximum temperature and promoted temperature uniformity compared to our other iterated designs. Having four pathways reduced the possibility of hot spots in the heat exchanger, and putting the inlet and outlet next to each other reduced the temperature gradient along the length of the heat exchanger. The battery cold plate was manufactured from 6061-T6 aluminum because it was the cheapest aluminum available to our team. We used SendCutSend to laser cut thin plates and we CNC-milled the unique patterns ourselves. The small squares on the battery cold plates represented where the batteries would sit on top of the cold plate (with electrical insulation directly beneath the batteries). The battery cold plate had two aluminum plates (the one with NPT ports being the top side) that needed to be clamped together so water did not leak. Torque calculations were done with water pressure in mind (based on flow rate and simulations). Using 29 8-32 bolts allowed for a safety factor of 3 for water pressure, which would more than compensate for whatever gasket we'd use. Three 1/4 - 28 bolts were present so the cold plates may be installed in the accumulator box.
Due to the shape of the heat exchanger, a unique gasket would need to be manufactured. It is customary to order O-rings from companies who specialize in them (Parker-Hannifin for example), but the combinations of gasket thickness and diameter did not suit our needs. We proceeded with sheets of black nitrile rubber, which were laser cut to the outline of our design. First, the cross-section of the gasket was chosen such that the gasket would fill less than 100% of the groove in the cold plate, then the desired compression was chosen. This allowed us to determine what the required compressive pressure (and force) would be needed to reach the desired height. This force was factored into the torque calculations to confirm that the chosen fasteners could withstand the added force (which they did).


CAD model highlighting gasket location, cross-sectional profile of gasket, and pressure/force graph
The heat exchangers not only consisted of an aluminum cold plate, but thermally conductive fins as well. It was particularly difficult for air to transfer heat from the battery radially, as the batteries were packed so close together and there are not easy pathways for hot air to escape. Only having a conductive surface on the bottom of the batteries posed the problem of hotter temperatures at the top of the battery. To promote better heat transfer from the top of the batteries to the cold plate, conductive material would be used along the length of the batteries. The main concern would be electrical insulation, as the design competition requires that the accumulator box is electrically insulated from other components of the car. Most materials are both thermally and electrically conductive or thermally and electrically insulating, so finding our desired material was not trivial. After some extensive research, we discovered aluminum nitride ceramic. This material poses a thermal conductivity of 170-180 W/m*K, while boasting an electric strength of ~17 kV/mm (battery packs have 120V each, meaning less than 1 mm of material thickness would work). This thermal conductivity far surpasses potting compound, a common electrical insulation material that features a thermal conductivity of around 1-2 W/m*K. Our team decided to use potting compound to attach aluminum nitride fins to all of the batteries. Underneath the batteries, squares of aluminum oxide ceramic would fulfill the electrical insulation requirements (needed to change material because of lack of budget, aluminum nitride has superior thermal conductivity so it would have been used otherwise).
We generated simulations on ANSYS to compare the temperature gradient along the batteries with and without AlN fins, setting the top of the battery to the maximum operating temperature and using heat generation calculated with the current squared times the electrical resistance of the batteries. This heat generation was applied for 25 minutes, similar to the length of the endurance event. The fins are 0.5 mm thick, constrained by how close the batteries were packed together. The model with fins shows a much lower maximum temperature than the one without, heavily supporting the use of ceramic fins.


Simulation results on a single battery cell (left only has potting compound, right has potting compound and 70 mm tall ceramic fins)
Motor/Inverter Cooling Loop
Though less critical of a loop, the motor/inverter cooling loop warranted its own attention. The electric pumps here were the same as the one in the battery cooling loop, but two were used as there are more components in this loop. The loop extended to the front and back of the car, which added major losses. The AMK dd5 hub motors operated on the front wheels, while the back wheels were driven by a single EMRAX motor. Gaucho Racing produced two custom inverters for the hub motors, while a DTI inverter assisted the EMRAX motor. A swirl pot joined the coolant (water) from the two pumps, then pushed the combination through a purchased radiator (bought from the shelf of a hardware store, it was purchased before I joined the team). After being cooled by the radiator, the water made its way to a water reservoir, where it would be cycled back to the electric pumps. Unlike the battery cooling loop, ice was not added to this water reservoir. The motors and inverters had significantly higher operating temperatures, so it was not as necessary. Not having ice would slightly reduce the weight of the car.
The EMRAX motor, DTI inverter, swirl pot, and radiator all had built-in cooling channels, which made including them into the cooling loop fairly simple. However, the AMK motors and custom inverters did not have built-in cooling. This meant our team was responsible for constructing heat exchangers for these components.

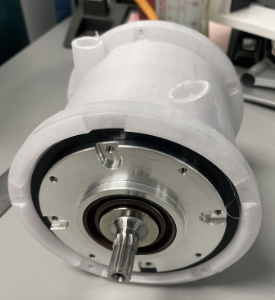
EMRAX motor


GR25 featured hub motors in the front wheels so the vehicle benefited from more power and didn't have concerns with gears wearing out. The manufacturer site strongly recommended cooling channels be built for the motors. Unlike the battery packs, which used a heat exchanger in the form of a slab, the motor required a cylindrical heat exchanger. This raised questions related to internal manufacturing:
-
How would threads be structured such that they could guide water coolant along a specified path for the motor?
-
How would a groove be carved into the heat exchanger so a gasket could prevent water from catastrophically leaking out of the heat exchanger?
After heavy consideration, our team decided that we would use material extrusion (3D printing) to produce our desired "cooling jackets". Not only would this allow for complicated internal geometries, but the print would weigh less than a heat exchanger of the same dimensions made of metal. This solution was also more cost-effective. Polycarbonate has a heat deflection temperature of 117 ºC. Although that is very close to the maximum operating temperature of our motors (120 ºC), thermal resistance calculations showed that the inside of the motor would exceed 120 ºC before the heat exchanger reached 117 ºC. The heat exchanger had two barbed ports on opposite ends (one inlet and outlet). While adjacent ports provided more temperature uniformity for the battery pack cold plates, it would be harder to control fluid uniformity with that method with a cylinder. Our team originally wanted to use NPT ports for this components, but using a tapered thread proved very challenging for 3D prints. Using barbed ports meant the plastic tubing could be directly pressed onto the ports. Some iterated models cracked when attempting to tap. Two gaskets were included for the cooling jacket, one internally installed and another that sealed when the jacket slides onto the hub motor.

DTI inverter
Off-shelf radiator
As for the custom inverters, they were essentially individual slabs containing MOSFETs which converted direct current into alternating current (which the motors worked off of). Our team quickly agreed that the same method of cooling as the battery cold plate would suffice here, although fins would not be necessary. The inverters were far more exposed to air that can circulate. A substantial restriction of this project was the lack of space available for all of the components that would go into this vehicle. This led to the idea of using a single head exchanger for two inverters. There would be inverters on both sides of the heat exchanger, which birthed the concept "inverter cold plate sandwich". Ironically, DTI released an inverter model after we started making this system. Their inverter featured two inverters on opposite sides of a cooling channel, which was fundamentally the same concept as what we were chasing. This verified to us that we were chasing a promising design, as a company of professional engineers believed this was worth marketing.
Our inverter cooling plate features four NPT ports (two inlets and two outlets) so that each inverter could have their own cooling channel. The two channels were separated by a single aluminum slab. Inside each channel, two pathways existed compared to the battery cold plate's four pathways. It was not as necessary to produce a complicated pattern, as the design is far more compact. The gasket system was conceptually the same as the battery cold plate, with three 1/4 - 28 bolts being satisfactory for clamping force. The exterior of the cold plate was made of aluminum 6061-T6. Each side of the cold plate featured six holes for the inverters to be fastened to the cold plate.
Cooling jacket visuals (CAD model with barbed ports on left, prototype originally attempting NPT threads on right)


Testing
Inverter heat exchanger (CAD model of half on left, CAD assembly with both inverters in middle, final model with one inverter on right)
The first critical aspect our team tested for was heat exchanger leakage. This was not only for the safety of the driver, but a rule requirement from the design competition. Our team did this by connecting individual heat exchangers in a loop that contained one EBP 40 12V electric pump, one water reservoir, two pressure gauges (on each side of the heat exchanger to measure pressure drop) and a flowmeter. This would be connected on our assembled test structure, largely consisting of 80/20 aluminum and L-brackets. Once the loop was closed, water was added to the loop with a hose and assisted by running the pump at low power. The pump was shut off after the entire loop was filled. Following this, hand towels were used to make sure the surround area was completely dry. Once ready, our team would ramp up the battery supplying the pump to the maximum rater power (60 W, done by adjusting voltage). We monitored the heat exchanger and floor to see if any leaking occurred. After five minutes, the battery supply was turned off and the testing site was disabled.
The battery and inverter cold plates passed this test easily, with no visible leaking. However, the motor cooling sleeve did not share the same success at first. This is mostly because of the porosity of the 3D print and the small gaps in the ports. Our solution to this was to coat the cooling jacket with clear sealant. This would prevent water from seeping out of the walls of the cooling jacket and close any gaps in the barbed ports. Applying this eliminated leaking from the original sites.

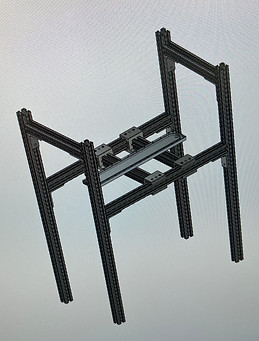

Test fixture visuals (without heat exchanger on left, CAD model in middle, video of loop setup on right)
The other main test our group completed was thermal characterization of our battery cold plate. We did not have time to create the proper testing resources for thermally testing all of our custom heat exchangers, so we focused on only the battery cold plate. To accomplish this, we first needed a reliable way to enforce heat transfer into the cold plate that replicated the conditions from the battery pack. This was done with three conductive heating elements that heat up when connected to power. These elements were connected to a milled aluminum plate with thermistors placed along grooves underneath the plate. This was done to test uniformity of the heating element. The aluminum plate's bottom was covered with thermally conductive pads that prevented damage to the thermistors from compression. The pads also helped the plate stick to the heat exchanger being tested. Finally, the heat exchanger and heating plate were surrounded by a styrofoam cooler to prevent heat loss to air. Small holes were made for electrical cords to fit through.
Two custom inline temperature sensors were added to the cooling loop at the inlet and outlet. This was done so the temperature of the water at both ports could be measured, which would be useful for heat transfer coefficient derivation. All temperature sensors were connected to an Arduino that would continuously detect temperatures at the desired locations. The heating elements were powered by a transformer that allowed 120V to reach each of the heating elements in parallel. This corresponded to 125 W of heating from each heating element (375 W total), all of which was assumed to be directed to the battery cold plate in planning.
The set up for the cooling loop was largely the same as for the leak test. However, the pre-chilling aspect mentioned in the battery cooling loop was added. This testing site swapped out water reservoirs from the one in the previous test fixture so that it was sealed and reduced heat transfer to the surrounding air. This reservoir featured a cap that could be removed so ice could be added to the loop. As ice was added, hot water was removed from the loop by opening a port at the bottom of the reservoir. The temperature of the water was monitored by the inline sensors. The process of adding ice and removing water was repeated until the sensors detected the water had reached a steady state close to 0 ºC. Once this state had been reached, the loop was closed and the transformer was turned on so heat transfer could begin. The transformer was left on until the sensors on the thermal plate reached 40 ºC, which thermal resistance calculations showed our team that the top of the battery pack had reached 60 ºC. The transformer was deactivated, and the styrofoam cooler was opened so the system could cool down faster. The Arduino was turned off during this cooling, and the testing site was disassembled once properly cool to touch (which we classified as room temperature). The results not only gave us a length of time that a single heat exchanger would run for before the battery pack overheated, but also gave the appropriate temperatures to produce a heat transfer coefficient. Our heat transfer coefficient was calculated using LMTD (Log Mean Temperature Difference), a fairly common method of classifying heat exchanger effectiveness when inlet and outlet temperatures of coolants are known.

2-D schematic of heat transfer layers


Testing fixture components (heating plate on left w/ thermistor slots, thermally insulated box on right)


After generating plots from the experiment, our team noticed the varying heat transfer coefficient over forty minutes. The heat transfer coefficient was generated using the LMTD equation with measured temperatures, each sampled at 300 Hz. This was likely due to a combination of thermal losses to the environment (despite attempts to thermally insulate system) as well as the quality of thermal measurements. Thermistors are a nonlinear temperature sensor, which could have led to larger variations in measured temperature. The team for the following year is still trying to get a definitive answer for this question. For the purposes of this project, our team used the lowest heat transfer coefficient measured (1390 W/m^2K). Using this value would provide the least effective heat transfer, which theoretically would guarantee that the actual heat transfer would be better.
The endurance event is approximately 22 km, which typically takes between 20-30 minutes to complete. Without a cooling system, projected power simulations estimate the battery packs would heat up by 5 ºC each lap. 22 laps results in 110 ºC temperature change throughout the race, well over the acceptable temperature restraints of the battery packs if the cooling loop starts at 0 ºC. Our vehicle would have to throttle down to 58% power in order to finish the event without overheating. Introducing our heat exchangers increased power usage from 58% to 81%, which lap simulations dictate save about 99 seconds over the endurance race (~3% improvement in time). While the power usage increases by much more than 3%, the power has to be managed so the vehicle can safely make the turns.
If purely interested in cooling at max power, the vehicle cannot run for longer than five minutes at maximum power without overheating (using no cooling system). The designed cooling loop extends this to about nine minutes, almost doubling the time the vehicle can drive in a straight line at full power. Considering how most consumer vehicles find themselves driving on a long freeway for extended periods of time, this may be more helpful in terms of processing how much this cooling system helps.
Equation for heat transfer and experimental result plots (Tw = wall temperature)
During the Competition

On June 13, 2025, I graduated with my bachelor's degree from UC Santa Barbara. I was celebrating the end of my time as an undergraduate with my family, preparing my schedule so I could focus on traveling for swim meets, and breathing a sigh of relief about finishing the year long cooling project. The Michigan design competition was the following week, but I was not supposed to attend. I knew I would be returning next year and wanted to leave the spots for the numerous graduating seniors. They were supposed to leave on June 15 and return roughly a week later.
Approximately thirty hours before takeoff, I received a message from two of my friends from the cooling project. Their third driver had become very sick and could no longer assist with driving the school's electric vehicle across the country. They asked if I had any interest in going. I briefly discussed this with my family and received their support in participating, even though it was immediately after graduation. I spent the next day frantically packing up my room so my subleaser could move in during my absence and attending my friends' graduation ceremonies. After a night of rough sleep (this would not be the only one), my friends arrived with a truck and trailer. We took turns driving from 3:45 AM on June 15 to 7:30 PM on June 16, stopping only for gas and quick meals.
Driving was a small portion of the work our team had to put in. Arriving at the competition, our electric vehicle had not even properly rolled yet. We had a chassis with a seat and steering column, while the rest of the car was separated in unorganized packages in the back of the trailer (except the cooling system of course). Our team had two days to assemble our vehicle before the technical inspections began. I don't think I've ever seen a group of thirty people work as diligently as we did during this time. We were able to get our vehicle consistently rolling, install the aerodynamic portions of the car, prepare the battery packs, and set up the brake/gas pedals. The vehicle was stationed at a reserved parking space on the Michigan International Speedway, which we were allowed to work on from 7 AM to 5 PM each day.
The day before technical inspections, two judging panels occurred for the team. One panel addressed the engineering of the car, while the other managed the business aspects of the project. My time was spent with the engineering panel, considering how all of my time during the school year concerned that line of work. I was able to shadow and assist the team leads with presenting the vehicle to the judges. A single judge is responsible for a particular section of the car, so it was a casual Q&A where people could move between judges to help with answering specific questions. Someone could answer questions concerning the powertrain with one judge, then walk to another judge and help with aerodynamic design explanation. Our team did this for half an hour, then returned the vehicle to its designated station and continued working.
Pit stop in Utah with GR 25 (UCSB's electric vehicle)

The next day essentially determined whether the vehicle will race or not. There were six levels of technical inspections that must be passed, the first two being the most detailed. An accumulator inspection was in place so the competition could investigate how effective and safe the power supply of the electric vehicle was. This included testing indicators of high voltage, verifying that the material separating stacks of batteries are electrically insulating, and if there was an emergency stop for charging. This test only required the accumulator, while the mechanical inspection demanded the rest of the vehicle.
The mechanical inspection was used to prove that the vehicle contained all the correct non-electrical equipment and alignment. There were nine stations in this detailed examination which included:
-
Wheels
-
Driver equipment
-
Chassis features
-
Cockpit
-
Steering
-
Motor protection
-
and many more categories
After passing both the accumulator and mechanical inspections, the team could then proceed with the following inspections in order:
-
EV active (electrical testing of the vehicle while running)
-
Tilt (vehicle can safely operate on a non-horizontal plane)
-
Rain (vehicle is resistant to weather)
-
Brake (vehicle exerts sufficient braking forces for safe driving).
If vehicles did not pass any inspections, they were able to arrange private appointments later in the week where they could take time to correct faults discovered in the preliminary inspection. It was a rigorous process that most teams did not finish entirely (20% passed in this year's competition).
Our team was not able to successfully pass either of the first two inspections. There were several faults on both tests, but I'll focus on the most critical of both. The battery packs used very specific crimps - electrical ports used to connect electrical systems. Unfortunately, one was damaged in the process of crimping onto a wire that interacts with a battery pack. The crimps were fairly expensive, which meant the minimum amount (ten) were purchased. Ordering new ones would take too long, and the accumulator could not pass the inspection without all ten crimps. On the mechanical side, the steering column was not up to the standards of the competition. When changing directions, the wheel must not have more than 7 º of slack before the wheels move. Our team designed a steering column with a U joint and was not properly tested before the competition, so our team saw a slack of around 15 º. This alone prevents the vehicle from passing. When our team discovered this, our situation became dire as it was incredibly unlikely for the column to be fixed without building an entirely new one. Our team ultimately had to surrender the possibility of racing at the competition. We did want to receive as much feedback as possible, which is why we tried to correct as many minor mistakes as possible and redo the appointment. In the second appointment, I made sure to record the faults on my phone so that we could keep them in mind for next year's design.
Photograph taken of the judging panel environment


GR 25 being weighed and inspected at the mechanical tech inspection
A few hours after failing the initial technical inspections, the judges we talked to previously arrived at our station to give feedback about the design of the vehicle. This was ultimately the most important part of the competition, as it scores the work from over a year that racing metrics don't quite portray. We received advice on making a flowchart for design choices, where we should increase surface area of aerodynamics, fixing measurement noise with the accumulator, adding more room for knees, and other notes.
As for the cooling system, we did not install it because the people involved in that project (myself included) prioritized working on installing other fundamental parts of the car. However, we did take the time to have our supplies prepared in the chance that it was time for the cooling system to be installed. We had planned from both CAD models and analyzing the physical chassis where each component (water reservoir, radiator, tubing, etc.) would go. Therefore, we did not receive any meaningful feedback on the cooling system. This is something I noted for next year's model; we should install as much as possible on the final product according to vehicle design as possible. We knew we weren't going to be able to test the cooling system on the car, but it would have been useful to gain feedback from the judges. We won't make that mistake again.
Overall, we received a score of 60/150 on our design. This should be looked at less through the lens of scholastic grading and more through the lens of "50% is average", as the judges explained. It is the best score our team has received yet, although this is our third year of competition.We tied for 55th place in terms of design out of 80 eligible teams, and got 56th factoring in every score across the competition (cost report, presentation, racing events). We left the competition site two days later, having done our best to produce a working vehicle and gaining valuable insight into how quickly the work moves at a design competition.
After the Competition
Heading into our fourth year of attempting to produce an electric vehicle, UC Santa Barbara's F-SAE team is eager to learn from its mistakes and race for the first time in Michigan next year. Many of us have been active since returning in late June, and I'd like to take the time to show what I've been up to since.
Gaucho Racing's newly appointed mechanical technical director, Colin Hoi Heng Kwok, reached out to me shortly after the Michigan design competition and requested my assistance with next year's cooling system. I happily agreed, hoping to offer some insight as the cooling team's only returning member and solve the issues we were having. We intend to keep a lot of the same cooling loop from the previous year considering it was never truly tested on the vehicle, but we will make a few changes based on new battery pack dimensions and updated models on cooling effectiveness.
Cooling Loop Flow Rate Simulations
With heat exchangers, it is crucial to know how fast the coolant is flowing through the loop. Fluid velocity impacts a variable of heat transfer called the Nusselt number, which is directly proportional to the heat transfer coefficient. In last year's cooling loop, our flow rate was empirically solved by varying our electric pump's (EBP 40) power and recording our flowmeter. What confused our team was the flow rate with maximum pump power, using a single battery heat exchanger, yielded about 1.6 gpm - less than half of the value one previous member completed a simulation with (4.5 gpm). We never really solved the answer as to why this happened, but our team suspected losses from the pipe and fittings were more involved than initially modeled. My short-term goal is to verify why we got the flow rate we did using our previous pump. Answering this will allow for accurate head losses to be modeled with hypothetical configurations. This will allow our team to determine if we need to make changes to the cooling loop structure, add more pumps, or buy a higher quality one.
The easiest head loss to calculate is from the tygon tubing. I estimate that last year's cooling loop had six feet of tubing (the fixture was three feet long). The first step of calculating this head loss is to pick a flow rate (for example, 1 gpm). Using the tube diameter, the flow rate can be converted to velocity, which is then used to determine the Reynold's number. The relative roughness must be derived as well, which takes the tube's material roughness and divides by the diameter. The next step is to solve for the friction factor, which is dependent on whether the flow is laminar or turbulent. If the flow is laminar, a single elementary equation is used. However, the Colebrook-White equation is an iterative process where a friction factor is assumed, then inserted into the equation to solve for a new friction factor. This is done until the new and old friction factor are about the same (I kept within four decimals of error). A Moody diagram can be used as well, but using the equation is more reliable and easier to write a program with. Having the friction factor allows for a head loss equation to be used.

Having outlined this process, the major losses from tubing can be compared with the pump's capabilities. The pump manufacturers provide a pressure head vs. flow rate plot, which visualizes what the tested flow rates of the pump are when interacting with a specific head pressure. I wanted to have a visual for how fast water could flow through a varying amount of tube length provided a single pump, so I created a MATLAB program which iterated the flow rate of cooling loop. The length started at six feet and increased by three feet for each iteration. The flow rate ranged from zero to ten gallons per minute. The results indicate that the major losses from the tubing is more important than my previous group considered.
Relevant equations related to major head losses

Manufacturer pump curve

The cooling loop lengths increase as the reader goes up and left. With six feet of tubing, our pump should never produce more than roughly 5.3 gallons per minute. However, this loop experiences about 0.5 m of head loss at 1.6 gpm, which is far from the ~7.75 m of head pressure that is associated with the pump at this flow rate. In order for this model to work, the head losses from a single battery heat exchanger, pressure/flow sensors, water reservoir, and fittings need to add up to about 7.25 m of head pressure (at full pump power).
The next steps for this process are to quantify the minor head loss from fittings theoretically, then empirically test the remaining components with last year's test fixture. This process was verified by a fluids professor at UC Santa Barbara recently. I am currently scouting last year's memory drive for a video of our tested cooling loop so I can count what/how many fittings were involved. When the fittings are accounted for, the process is very similar to the tubing losses. Once I return to UC Santa Barbara, I intend to take a prototype of last year's battery cold plate and set up a concise circuit. The water will flow from a water reservoir to the pump, then to the plate and finally through a flowmeter connecting back to the reservoir. This will be done with a negligible length of tubing (ideally less than half a foot). The pump will be used at full power, and the resulting flow rate will be recorded.
I will assume that the relationship between pressure head and flow rate for empirically tested components follows the same principle as the tubing major losses (pressure head = fluid velocity squared times a constant). Using the data point collected from the experiment, the constant can be solved for. The flow rate will be evident from the flowmeter, and the pressure head will be taken from the manufacturer plot at that specific flow rate. When the formulas for minor losses in fittings and losses in larger components is solved, I will iterate with flow rates the same way I did with the tubing and add these plots to the tubing one. If the resulting plot indicates that the flow rate for last year's loop maxes out at 1.6 gpm, I will know that the MATLAB program works and is reliable for predicting head losses if we change the loop. Our team will be able to simulate heat exchanger effectiveness before it is even manufactured.
If the values do not match, I will test the flow rate through six feet of tubing and a flowmeter to see if the experiment matches with the calculations. I will then need to make a decision from there about whether we should continue to attempt simulating flow rate or if we will just have to test the finished loop later in the year.
Simulated major losses from tubing (6 ft loops to 60 ft loops)
My Next Moves
Having outlined my planned procedure for modeling the flow rate through our cooling loop, I have shifted my focus to the thermal aspects of the project and planning for the school year. Our lack of organization was apparent to me throughout the Michigan design competition, so I'd like to take a step with the team next year to help document across all groups. Building this website is actually part of practicing for that. I will be joining other teams' meetings on a semi-weekly basis, making sure I understand their calendars for production and doing what I can to help them stick to them. This can range from modifying CAD models to running simulations to even manufacturing parts.
As for the cooling project, I am currently reading a thermal textbook ("A Heat Transfer Textbook, 6th Edition" by John H. Lienhard V). This is giving valuable insight on how to quantify heat exchangers - a subject that UC Santa Barbara covers in courses later in the thermal series than we are required to take - and refreshing my understanding of transient/steady state conduction and convection. We intend to complete a working model of our cooling loop by the end of the calendar year (before 2026), which should not take very long once the dimensions of the new battery packs are finalized. This will give our team ample time to thermally test our cooling loop, a luxury we did not have last year.
I will be regularly updating this website with relevant progress as it happens. Thank you for taking the time to read this project!